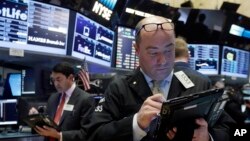
The first trading week of February 2016 saw more volatility on U.S. markets due to continued weakness in crude oil and massive moves in the U.S. dollar and global currencies. Just in the last five trading sessions, the S&P 500 has traded in nearly a 100-point range.
Even though crude plummeted from $112 in July 2014 to the low of $27 in January 2016, the commodity continues to struggle to find a floor in price. This is due to the very basic economic principle of supply and demand. There is simply too much supply in the global market place, storage for the product is running out, and OPEC and non-OPEC producers are at a stalemate regarding production cuts.
U.S. crude inventories climbed by 7.8 million barrels in the week of January 29 to 502.7 million barrels, the Energy Information Administration said on Wednesday, further increasing supply.
Until a significant amount of supply comes out of the system, the crude complex will remain under pressure and oil-dependent nations across the globe will have a difficult time maintaining and instituting a realistic budget. In fact, Nigeria and Angola are in talks with the World Bank and International Monetary Fund to help secure funding support as government budgets have largely been funded by oil revenues.
The limited bright side in crude oil trade this week was the weakness in the U.S. dollar. As the greenback moves lower, instruments like oil and gold generally move higher, and the inverse typically applies due to the strong correlation in the moves.
Recently, trading in the S&P 500 has been highly correlative to movements in the crude oil market. In the very short-term that may be true, but a chart of the S&P 500 compared to crude oil shows evidence of the divergence between the markets from the 2014 crude peak. Arguably, the volatility can be attributed to the currency crisis, following some very recent central bank monetary policy shifts.
Interest rate hike
Perhaps one of the more monumental policy shifts was the U.S. Federal Reserve’s decision to raise interest rates by 0.25 percent on December 16, 2015. The market was anxiously anticipating the first raise in nearly a decade, but the move was instituted in the face of weak economic data and slowing global growth. In recent weeks, other global central banks have either moved to a negative interest rate environment or have devalued their currency.
For better or worse, central bank rhetoric deeply impacts the markets and it seems as if bankers are “testing the waters” to gauge the financial community’s reaction to the suggestion of rate increases and decreases.
On Friday, a mixed Non-Farm Payrolls in the U.S. fueled more uncertainty as the headline number disappointed versus consensus estimates. (151,000 versus 190,000). On the other hand, the unemployment rate moved lower to 4.9 percent as more participants entered the work force and wages jumped 0.5 percent.
"Both earnings and economic data continue to slow down, and that's not good for Main Street or Wall Street," said Adam Sarhan, CEO of Sarhan Capital. "Surprises are happening to the downside — not the upside. Intermediate and long term we are in the early stages of a new bear market for stocks.”


